June 22, 2016 / by Kate Davies /
The importance of images in chemistry
While there are many tangible chemical properties, the underlying reasons for these macroscopic properties can be abstract. Understanding requires a knowledge of what is going on at a level that is impossible to see with the naked eye. Subtle differences can meaningfully impact the properties of materials we use every day.
Why do we need images to teach chemistry?
Let’s look at some examples. Chlorine is a reactive, diatomic element which can be lethal if inhaled. One extra proton, one electron and four neutrons gives you neon - an inert, non-toxic monatomic element we breathe every day.
Even the same element can have different properties depending on how it bonds. Sodium metal is soft and reactive. In fact it reacts explosively with water. Remove one electron when it bonds with chlorine and you have table salt (NaCl). Now you can put it on your food or dissolve it in a glass of water.
One extra element can lead to large differences. Ethane (C₂H₆) is a gas at room temperature and is a by product of the refinement of crude oil. Ethanol (C₂H₆O) is a liquid at room temperature and forms through fermentation.
Even compounds with the same number of atoms of each element bonded in a slightly different way can have different properties. For example, R-limonene and S-limonene are almost identical. But R-limonene gives oranges their specific smell. While S-limonene smells like turpentine (with a hint of lemon).
The scale on which these interactions occur is as hard to grasp as the size of a supernova, or the seemingly limitless space between stars. Looking up at the night sky and trying to imagine the distance between us and the stars can be overwhelming. Similarly, thinking about the size of submicroscopic particles and their effects on macroscopic properties can be overwhelming.
To understand these changes it is important to be able to visualise what is happening. For this reason, images are essential to any comprehensive learning of chemistry.
Symbolic relationships, models and diagrams
One of the most important ways chemists represent submicroscopic entities is using symbolic relationships. That is, using letters and symbols to represents the elements present in a substance.
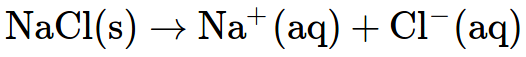
An equation like the one above describes what is happening in a reaction.
- The symbols show the elements present.
- The superscripts show the charges of the ions.
- The subscripts show the number of atoms of each element present in each substance.
- The number before each substance shows the ratio in which substances react.
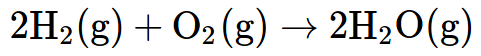
Again, these are quite abstract concepts. The explosive reaction of hydrogen gas and oxygen gas to form water vapour is represented by:
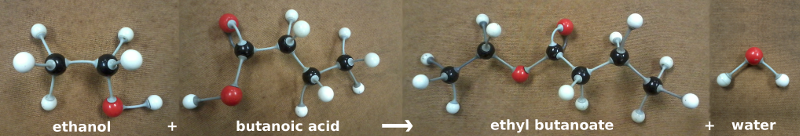
Therefore, it is important that learners are exposed to more visual representations. One great method is building models of substances with their hands. They can use chemistry model kits, but jelly tots and toothpicks work just as well. It gives a three-dimensional representation of what is happening at the submicroscopic level.
For example, organic chemistry 3D model kits are very useful when thinking about how an alcohol and an acid react to form an ester.
In the classroom it is important to build models. And online it is important to give visual representations of what is going on at the submicroscopic level.
There are various types of visual representations that can be used in chemistry. They can make use of circles to represent atoms. They can combine both symbolic representations of elements with diagrams. And some attempt to show three dimensions on a two dimensional surface.
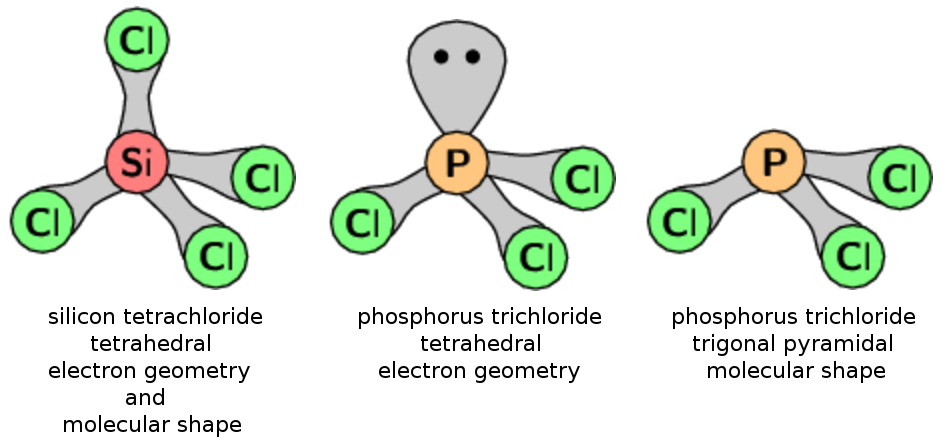
Electron geometry and molecular shape
In Grade 11, learners need to grapple with the idea that two molecules can have different molecular shapes but the same electron geometry. Or the same molecular shape and a different electron geometry! Diagrams are useful in showing how this is possible. For example, both silicon tetrachloride and phosphorus trichloride have a tetrahedral electron geometry. But silicon tetrachloride has a tetrahedral molecular shape, while phosphorus trichloride has a trigonal pyramidal molecular shape. This is because of the lone pair on the phosphorus central atom, but without diagrams this concept can be hard to grasp.
Submicroscopic diagrams to represent change
Submicroscopic diagrams can be used as an introduction to symbolic representations. Starting the year, Grade 10 learners might have little knowledge of using symbolic representations beyond the basic element symbols. By the middle of the year they would need to use them to represent chemical equations. So when talking about chemical and physical change it is unhelpful to give them only the chemical equation of a reaction.
Instead you can show them the reaction using submicroscopic diagrams.

White circles are hydrogen atoms, red circles are oxygen atoms. Both diatomic elements are shown in the gaseous phase. Two white circles and a red circle combined show water, also in its gaseous state.
These are the types of images and diagrams that we make use of to create meaningful, impactful learning experiences in our online, adaptive practice tool for Mathematics and Physical Sciences, Siyavula Practice.
Generating the actual diagrams
Siyavula Practice is not a bank of static questions. Rather, it contains generative question items. This means each question is actually an instance created from an exercise template. Each exercise template is built around one or more central concepts. But, the components, including images, quantities and scenarios, vary with each attempt of the exercise. We explain this further in our video on the technology components we have built.
So, an exercise on Siyavula Practice can contain more than just a static picture that asks a question. This possibility for variation means that the learner has to carefully read every question. Even on a second attempt of a similar question, generated from the same “template” as the previous question, they need to understand the question to answer it. Therefore, each of the diagrams mentioned above also need to vary to match the question and solution provided.
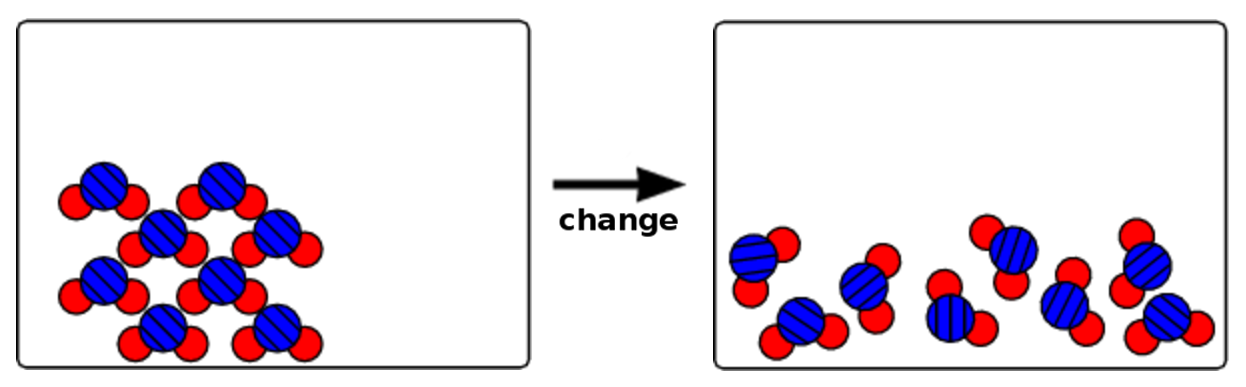
Submicroscopic diagrams can be used to show physical changes, including:
- phase changes such as melting.
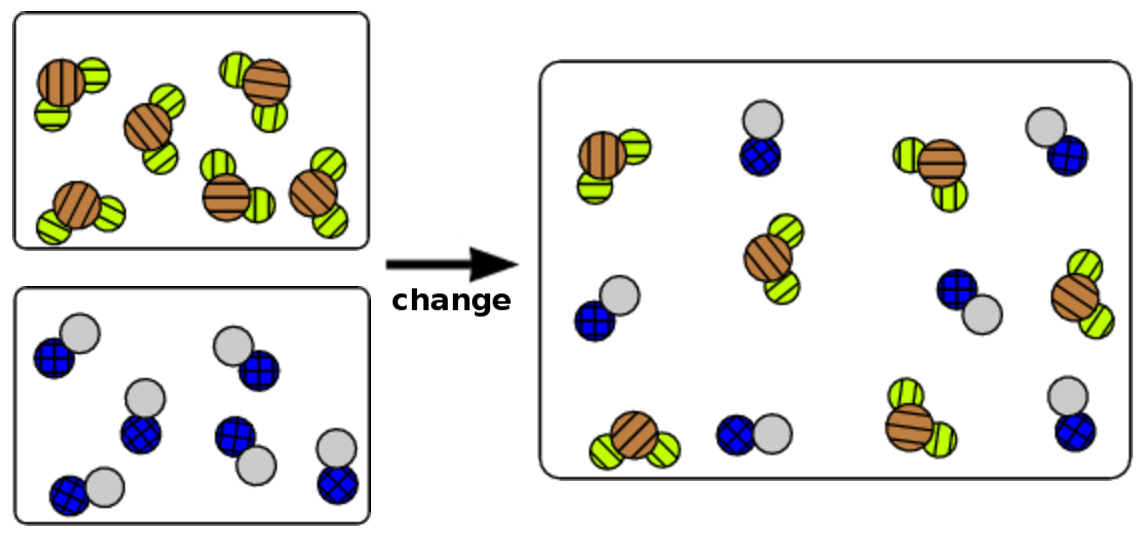
- two substances mixing, but not reacting.
- an ionic compound dissolving in water.

They can also be used to show how the types of substances present changes in chemical reactions, including:
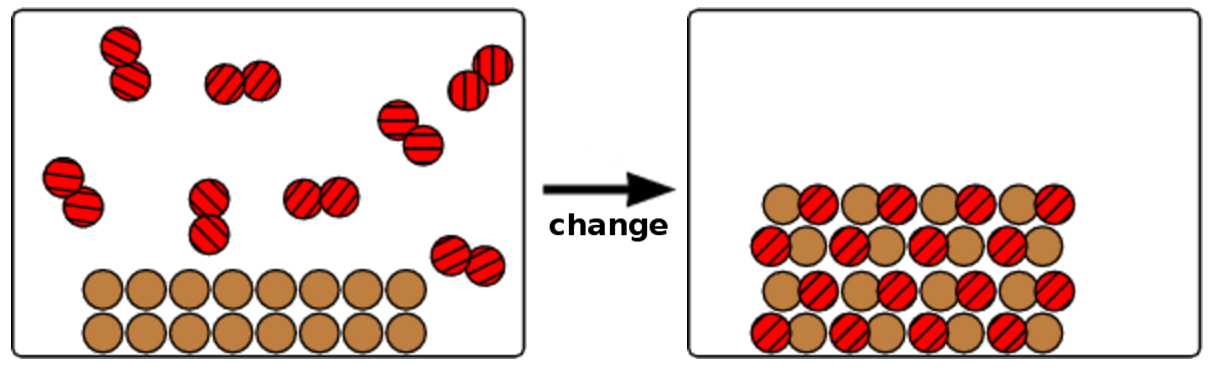
- a solid substance reacting with a gas to form a new, diatomic solid.
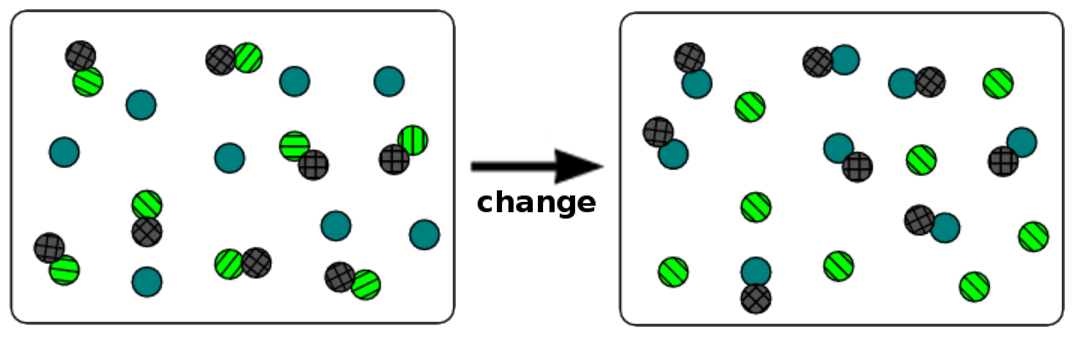
- a substitution reaction between a monatomic element and a diatomic compound.
We can encode this variation into our exercises, but it is important to make sure that all the diagrams generated adhere to the laws of Chemistry. Beyond that, it is important to make sure that the diagrams do not introduce any misconceptions or add to a learner’s confusion. As a result, making these sorts of diagrams requires time. But they are worth the effort!
These sorts of diagrams are so useful in understanding how chemical changes differ from physical changes or how specific physical or chemical changes occur. They also serve as a precursor to writing chemical equations and as a way to understand the conservation of atoms.
Check it out!
We will be adding more diagrams to our exercises going forward. If you would like to try out learning with the submicroscopic diagrams listed above, you can find them on our Siyavula Practice website! They live in the Grade 10 chapter Physical and chemical change. Get practising!