January 22, 2015 / by Megan Beckett /
Natural Sciences Training - Evaluating content knowledge (Part 3)
This post was originally published here.
As part of conducting the Natural Sciences training, we were asked to conduct a performance analysis, both before and after the workshops, to assess the subject advisors’ content knowledge. I think one of the main reasons for wanting this was to have some way of assessing the “impact of the intervention”, and a data-based performance analysis is often what is looked to as the easiest measure of impact. However, we were at first opposed to doing this right at the start as I felt that it would not be the most welcoming approach to administer a test as everyone first walks in the door. I also felt it would not set the right tone for the rest of the training.
We therefore opted to rather conduct a survey at the start of workshop 1 that focused on self-evaluation. This was similar to the survey that was sent out prior to the workshops via email, however not everyone had responded. We asked advisors to indicate their relative confidence levels in the various skills required for performing their duties as advisors, which included understanding of conceptual progression, integrating practical work in the classroom, designing assessment tasks, facilitation and mentoring.
After the first workshop, we then decided to conduct a more formal assessment of conceptual understanding, which I would like to discuss here. Please note, this is mostly for interest and should not be quoted or referenced out of context, especially considering our limited sample size. You can read more on the project goals and design as well as the workshop structure and resources used in my previous posts.
Design and administration of the test
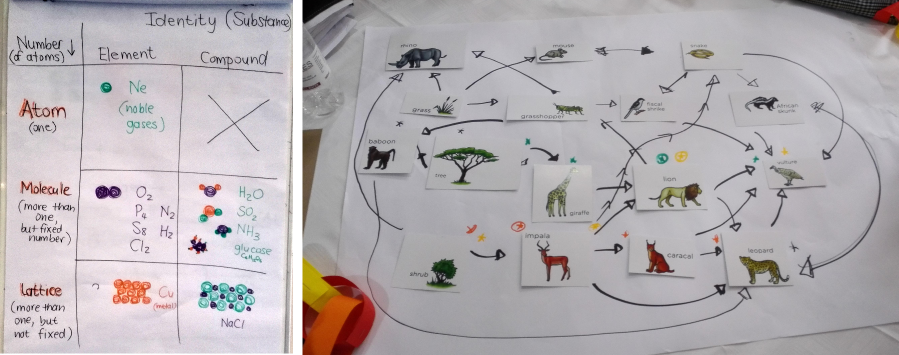
The test was designed to focus on the concepts that we would be covering in each strand for the remainder of the workshop, which were:
- Life and Living (L&L)
- Matter and Materials (M&M)
- Energy and Change (E&C)
We did not test Planet Earth and Beyond as this fell in the first workshop, except for participants at Cape Town workshop. In the design of the workshops and choosing which concepts to cover, we decided to focus on those topics that either form a central progression through the grades within a strand or they are viewed as particularly difficult concepts that most teachers and learners battle with. The test consequently focused on some of these topics, for which there are many prevalent misconceptions. We designed the multiple choice questions such that they would easily expose misconceptions that people have, as we included many “distractors”, and give a sense of the depth of understanding of these topics. We also asked participants to rate their level of confidence in their answers from a level of 1 to 4, with 1 being a blind guess and 4 being completely confident in your answer. I felt this would add another layer of evaluation and reflection. We gave them the exact same test at the start and then again on the last day, making sure to the scripts in between. The test was done anonymously and we allowed about 50 to 60 minutes to complete it.
Results
We collated and recorded the results and calculated a percentage for each question in each strand and also an average for the strand. We also then calculated an average percentage for the whole country and for each province.
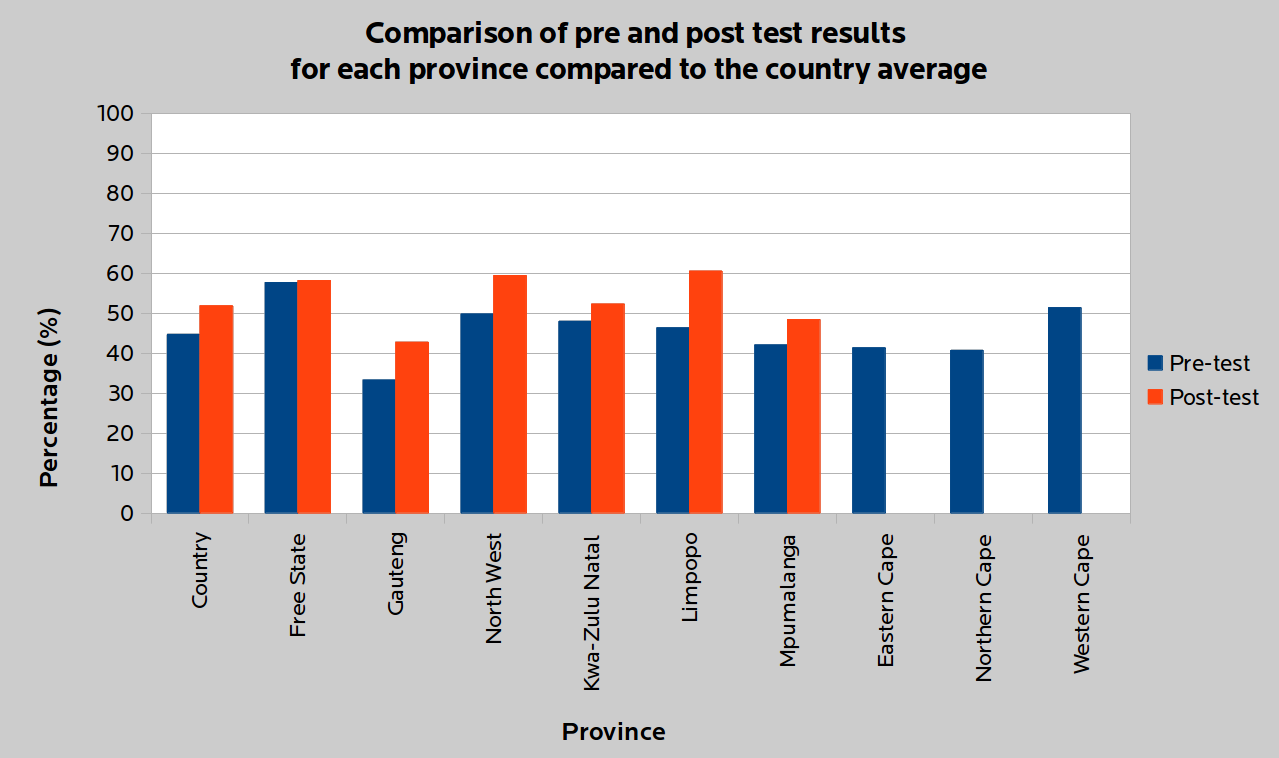
The following graph shows the results for pre and post-testing for the whole country (collating all 9 provinces) and then for each province. There are no post-test results shown for the Eastern, Western and Northern Cape as unfortunately due to time constraints in this condensed programme and travel arrangements, most participants did not attend the last day and therefore only 9 advisors wrote the post test. The results from these 9 tests are not comparable with the others and so they have been left out. The country average for the pre-test is 44.7% and for the post-test it is 52%.
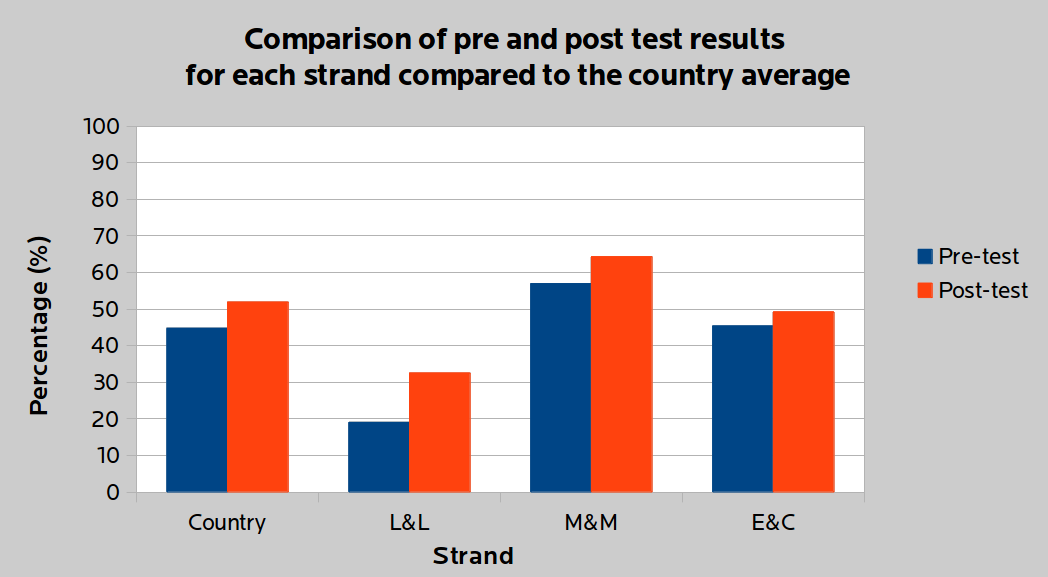
The next graph shows the same averages for pre- and post-test for the whole country but compared to the results in each strand, collated across the provinces. As can be seen, the scores for Life and Living were the lowest, but also showed the greatest increase of 14% from pre- to post-test.
Interpretation and discussion
It is important to interpret the results in relation to the test. The test differs from a regular school test or exam paper which aims to test knowledge at different cognitive levels from simple recall to deeper conceptual understanding. The test we administered focused the most difficult concepts, for which we know there are many known associated misconceptions. It was therefore quite challenging and it was also administered to the advisors without any warning.
The focus of the training, discussions and activities during the workshops was to then unpack these core concepts and bring to light the misconceptions that the advisors might also have. I think some interested stakeholders would have liked to see a larger increase from the pre- to the post-test results. However, we feel that the 8% increase is significant as it indicates that some learning has taken place. But, it also highlights the fundamental nature of learning, namely that it takes time and perseverance to grapple with your own alternative understandings and solidify your understanding. This cannot only be achieved within such a short time frame of one or two workshops. I think the workshops have served their purpose of opening up these discussions and bringing to light individual advisor’s weak areas and misconceptions for them to then start focusing on their own development and understanding from here on.
The Life and Living questions were also seen as particularly tricky, which may explain why this was the most poorly performing strand when it is usually viewed to be the least challenging of the four knowledge areas.
Although there was an increase in the results from before to after the training, it was relatively small. But I believe it is only the beginning. Administering exactly the same test 3 – 12 months from now would help shed more light on the real impact after the advisors have digested the material and even done their own training on it.
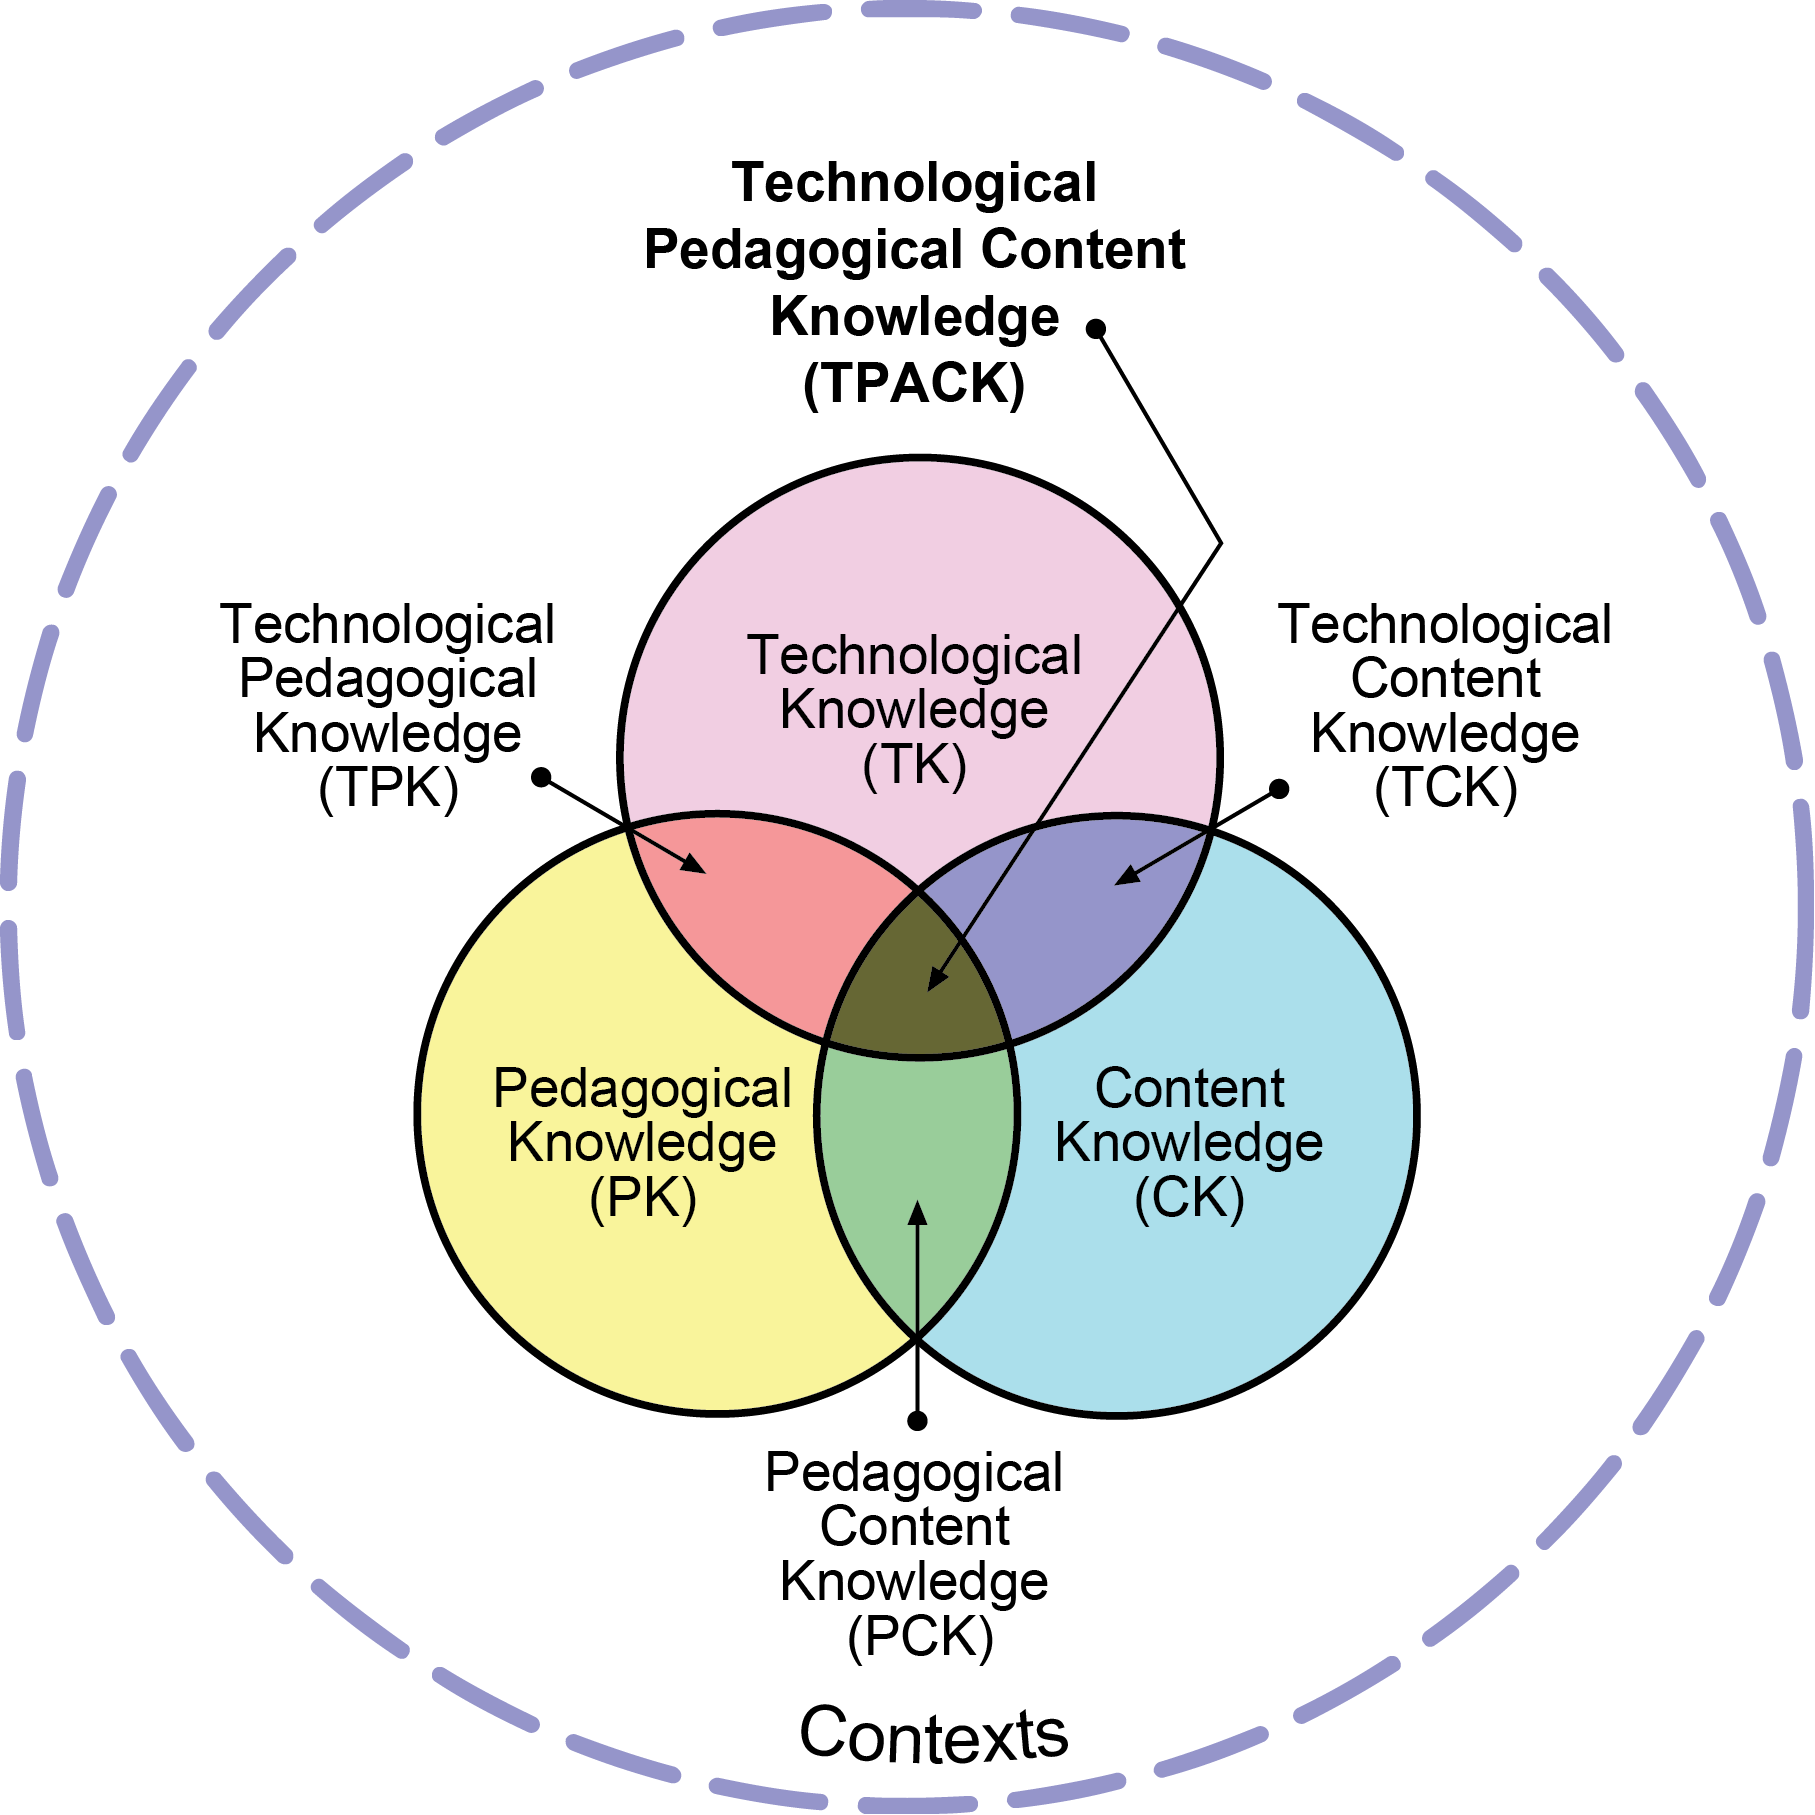
This test was primarily assessing Content Knowledge and associated misconceptions. Having Content Knowledge is the start, but not the end. We need to know how to teach those specific concepts and skills, namely having Pedagogical Content Knowledge (PCK), to be a truly effective teacher. Furthermore, we can extend this model when including technology in the learning process to say that a teacher has to have Technological Pedagogical Content Knowledge (TPACK), as shown in the Venn diagram below and explained further here. I think this needs to be used as a model for how we design and scaffold further training and subsequently, the impact assessment of that training.
A lot of the advisors admitted that they found the test really hard, but this did not discourage them or make them resentful towards us. They were open to the fact that they had to work at their own understanding and knowledge and that this is a continual process of development. I was extremely hopeful to encounter this open attitude among most of the advisors and see their determination and engagement throughout the workshops.
Take the test yourself!
We had many requests for copies of the tests, especially from advisors to use for their own training. The test, along with all other materials, is released under a Creative Commons By Attribution open licence. I have also created an online version of the test using Google Forms and a plug-in called Flubaroo, so that your results are automatically marked and an email sent with your score and the correct answers (should you get any wrong!).
Feel free to take the test yourself below. Any feedback is also most welcome!